Index Trend Analysis Report
Prepared for you on Tuesday, April 16, 2024.
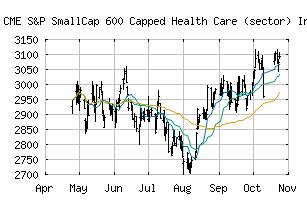
S&P SmallCap 600 Capped Health Care (sector) Index (CME:SP600C-35)
Weak Downtrend (-65) - SP600C-35 is showing signs of a strengthening downtrend. Monitor SP600C-35 as it may be building momentum to the downside.
Is it time to buy, sell, or avoid SP600C-35?
MarketClub looks at technical strength and momentum to determine if the timing is right for SP600C-35.
Learn more about the Trade Triangles and how we make technical analysis as easy as buy and sell.
|
|||||||||||||||
|
|||||||||||||||
MarketClub’s Trade Triangles for SP600C-35
![]() The long-term trend has been UP since Dec 22nd, 2023 at 3033.09
The long-term trend has been UP since Dec 22nd, 2023 at 3033.09
![]() The intermediate-term trend has been DOWN since Apr 11th, 2024 at 3030.82
The intermediate-term trend has been DOWN since Apr 11th, 2024 at 3030.82
![]() The short-term trend has been DOWN since Apr 11th, 2024 at 3033.95
The short-term trend has been DOWN since Apr 11th, 2024 at 3033.95
Smart Scan Analysis for SP600C-35
Based on our trend formula, SP600C-35 is rated as a -70 on a scale from -100 (Strong Downtrend) to +100 (Strong Uptrend).
| Open | High | Low | Price | Change |
|---|---|---|---|---|
| 3005.46 | 3010.98 | 2953.24 | 2964.88 | -29.40 |
| Prev. Close | Volume | Bid | Ask | Time |
| 2964.88 | 0 | 2024-04-15 17:04:07 |
| 52wk High | 3476.1 | 52wk High Date | 2018-08-31 |
| 52wk Low | 2260.79 | 52wk Low Date | 2017-12-06 |