Index Trend Analysis Report
Prepared for you on Thursday, April 25, 2024.
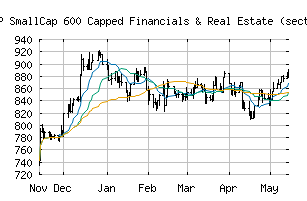
S&P SmallCap 600 Capped Financials & Real Estate (sector) Index (CME:SP600C-40)
Sidelines Mode (-55) - SP600C-40 is moving in a sideways pattern and is unable to gain momentum in either direction. Beware of choppy movement and consider a sidelines position until a stronger trend is identified.
Is it time to buy, sell, or avoid SP600C-40?
MarketClub looks at technical strength and momentum to determine if the timing is right for SP600C-40.
Learn more about the Trade Triangles and how we make technical analysis as easy as buy and sell.
|
|||||||||||||||
|
|||||||||||||||
MarketClub’s Trade Triangles for SP600C-40
![]() The long-term trend has been DOWN since Apr 15th, 2024 at 823.16
The long-term trend has been DOWN since Apr 15th, 2024 at 823.16
![]() The intermediate-term trend has been DOWN since Apr 10th, 2024 at 838.91
The intermediate-term trend has been DOWN since Apr 10th, 2024 at 838.91
![]() The short-term trend has been UP since Apr 19th, 2024 at 822.77
The short-term trend has been UP since Apr 19th, 2024 at 822.77
Smart Scan Analysis for SP600C-40
Based on our trend formula, SP600C-40 is rated as a -55 on a scale from -100 (Strong Downtrend) to +100 (Strong Uptrend).
| Open | High | Low | Price | Change |
|---|---|---|---|---|
| 856.55 | 857.90 | 847.36 | 856.70 | +0.13 |
| Prev. Close | Volume | Bid | Ask | Time |
| 856.70 | 0 | 2024-04-24 17:07:32 |
| 52wk High | 1077.01 | 52wk High Date | 2018-08-21 |
| 52wk Low | 913.41 | 52wk Low Date | 2018-10-25 |