Index Trend Analysis Report
Prepared for you on Friday, April 26, 2024.
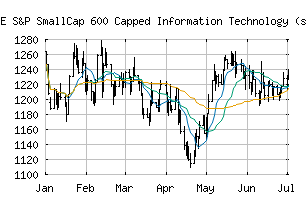
S&P SmallCap 600 Capped Information Technology (sector) (CME:SP600C-45)
Countertrend Down (-85) - SP600C-45 is showing short-term strength. However, look for the longer-term bearish trend to resume. As always, continue to monitor the trend score and set stops.
Is it time to buy, sell, or avoid SP600C-45?
MarketClub looks at technical strength and momentum to determine if the timing is right for SP600C-45.
Learn more about the Trade Triangles and how we make technical analysis as easy as buy and sell.
|
|||||||||||||||
|
|||||||||||||||
MarketClub’s Trade Triangles for SP600C-45
![]() The long-term trend has been DOWN since Apr 12th, 2024 at 1165.75
The long-term trend has been DOWN since Apr 12th, 2024 at 1165.75
![]() The intermediate-term trend has been DOWN since Mar 14th, 2024 at 1192.90
The intermediate-term trend has been DOWN since Mar 14th, 2024 at 1192.90
![]() The short-term trend has been UP since Apr 23rd, 2024 at 1136.95
The short-term trend has been UP since Apr 23rd, 2024 at 1136.95
Smart Scan Analysis for SP600C-45
Based on our trend formula, SP600C-45 is rated as a -85 on a scale from -100 (Strong Downtrend) to +100 (Strong Uptrend).
| Open | High | Low | Price | Change |
|---|---|---|---|---|
| 1148.06 | 1170.70 | 1148.06 | 1165.88 | +17.82 |
| Prev. Close | Volume | Bid | Ask | Time |
| 1148.06 | 0 | 2024-04-26 16:20:00 |
| 52wk High | 785.12 | 52wk High Date | 2018-08-31 |
| 52wk Low | 622.6 | 52wk Low Date | 2018-02-09 |