Index Trend Analysis Report
Prepared for you on Friday, April 19, 2024.
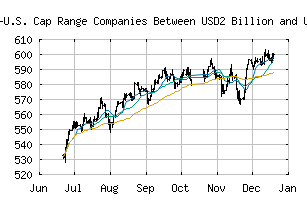
S&P Developed Ex-U.S. Cap Range Companies Between USD2 Billion and USD5 Billion (US Dollar) (CME:SPCRR2B5BRWUUSD)
Weak Downtrend (-65) - SPCRR2B5BRWUUSD is showing signs of a strengthening downtrend. Monitor SPCRR2B5BRWUUSD as it may be building momentum to the downside.
Is it time to buy, sell, or avoid SPCRR2B5BRWUUSD?
MarketClub looks at technical strength and momentum to determine if the timing is right for SPCRR2B5BRWUUSD.
Learn more about the Trade Triangles and how we make technical analysis as easy as buy and sell.
|
|||||||||||||||
|
|||||||||||||||
MarketClub’s Trade Triangles for SPCRR2B5BRWUUSD
![]() The long-term trend has been UP since Dec 14th, 2023 at 452.71
The long-term trend has been UP since Dec 14th, 2023 at 452.71
![]() The intermediate-term trend has been DOWN since Apr 12th, 2024 at 469.62
The intermediate-term trend has been DOWN since Apr 12th, 2024 at 469.62
![]() The short-term trend has been DOWN since Apr 10th, 2024 at 473.63
The short-term trend has been DOWN since Apr 10th, 2024 at 473.63
Smart Scan Analysis for SPCRR2B5BRWUUSD
Based on our trend formula, SPCRR2B5BRWUUSD is rated as a -70 on a scale from -100 (Strong Downtrend) to +100 (Strong Uptrend).
| Open | High | Low | Price | Change |
|---|---|---|---|---|
| 456.21 | 456.62 | 454.19 | 455.46 | +1.34 |
| Prev. Close | Volume | Bid | Ask | Time |
| 454.12 | 0 | 2024-04-19 14:30:50 |
| 52wk High | 506.58 | 52wk High Date | 2018-01-25 |
| 52wk Low | 405.02 | 52wk Low Date | 2018-10-26 |