Index Trend Analysis Report
Prepared for you on Thursday, April 25, 2024.
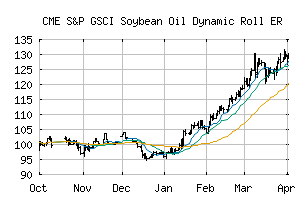
S&P GSCI Soybean Oil Dynamic Roll ER (CME:SPDYBOP)
Weak Downtrend (-65) - SPDYBOP is showing signs of a strengthening downtrend. Monitor SPDYBOP as it may be building momentum to the downside.
Is it time to buy, sell, or avoid SPDYBOP?
MarketClub looks at technical strength and momentum to determine if the timing is right for SPDYBOP.
Learn more about the Trade Triangles and how we make technical analysis as easy as buy and sell.
|
|||||||||||||||
|
|||||||||||||||
MarketClub’s Trade Triangles for SPDYBOP
![]() The long-term trend has been UP since Apr 2nd, 2024 at 99.049
The long-term trend has been UP since Apr 2nd, 2024 at 99.049
![]() The intermediate-term trend has been DOWN since Apr 11th, 2024 at 95.011
The intermediate-term trend has been DOWN since Apr 11th, 2024 at 95.011
![]() The short-term trend has been DOWN since Apr 25th, 2024 at 90.672
The short-term trend has been DOWN since Apr 25th, 2024 at 90.672
Smart Scan Analysis for SPDYBOP
Based on our trend formula, SPDYBOP is rated as a -70 on a scale from -100 (Strong Downtrend) to +100 (Strong Uptrend).
| Open | High | Low | Price | Change |
|---|---|---|---|---|
| 91.072 | 91.752 | 90.432 | 91.212 | +0.160 |
| Prev. Close | Volume | Bid | Ask | Time |
| 91.052 | 0 | 2024-04-25 12:46:38 |
| 52wk High | 61.695 | 52wk High Date | 2017-11-30 |
| 52wk Low | 46.5573 | 52wk Low Date | 2018-11-26 |