Index Trend Analysis Report
Prepared for you on Saturday, May 4, 2024.
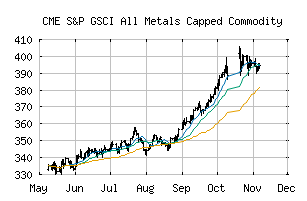
S&P GSCI All Metals Capped Commodity (CME:SPGSAMC)
Weak Uptrend (+65) - SPGSAMC is showing signs of weakening momentum to the upside. Monitor SPGSAMC as it may be in the beginning stages of a reversal.
Is it time to buy, sell, or avoid SPGSAMC?
MarketClub looks at technical strength and momentum to determine if the timing is right for SPGSAMC.
Learn more about the Trade Triangles and how we make technical analysis as easy as buy and sell.
|
|||||||||||||||
|
|||||||||||||||
MarketClub’s Trade Triangles for SPGSAMC
![]() The long-term trend has been UP since Mar 7th, 2024 at 280.42
The long-term trend has been UP since Mar 7th, 2024 at 280.42
![]() The intermediate-term trend has been UP since Feb 29th, 2024 at 271.42
The intermediate-term trend has been UP since Feb 29th, 2024 at 271.42
![]() The short-term trend has been DOWN since Apr 30th, 2024 at 309.16
The short-term trend has been DOWN since Apr 30th, 2024 at 309.16
Smart Scan Analysis for SPGSAMC
Based on our trend formula, SPGSAMC is rated as a +65 on a scale from -100 (Strong Downtrend) to +100 (Strong Uptrend).
| Open | High | Low | Price | Change |
|---|---|---|---|---|
| 306.47 | 309.41 | 305.49 | 308.32 | +2.04 |
| Prev. Close | Volume | Bid | Ask | Time |
| 308.28 | 0 | 2024-05-03 13:44:00 |
| 52wk High | 253.5703 | 52wk High Date | 2018-04-19 |
| 52wk Low | 201.0712 | 52wk Low Date | 2018-08-15 |