Index Trend Analysis Report
Prepared for you on Friday, April 26, 2024.
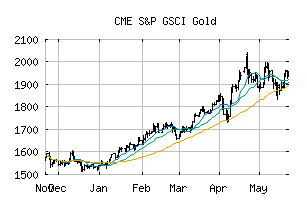
S&P GSCI Gold (CME:SPGSGC)
Weak Uptrend (+65) - SPGSGC is showing signs of weakening momentum to the upside. Monitor SPGSGC as it may be in the beginning stages of a reversal.
Is it time to buy, sell, or avoid SPGSGC?
MarketClub looks at technical strength and momentum to determine if the timing is right for SPGSGC.
Learn more about the Trade Triangles and how we make technical analysis as easy as buy and sell.
|
|||||||||||||||
|
|||||||||||||||
MarketClub’s Trade Triangles for SPGSGC
![]() The long-term trend has been UP since Nov 21st, 2023 at 1174.37
The long-term trend has been UP since Nov 21st, 2023 at 1174.37
![]() The intermediate-term trend has been UP since Mar 1st, 2024 at 1199.81
The intermediate-term trend has been UP since Mar 1st, 2024 at 1199.81
![]() The short-term trend has been DOWN since Apr 22nd, 2024 at 1388.45
The short-term trend has been DOWN since Apr 22nd, 2024 at 1388.45
Smart Scan Analysis for SPGSGC
Based on our trend formula, SPGSGC is rated as a +65 on a scale from -100 (Strong Downtrend) to +100 (Strong Uptrend).
| Open | High | Low | Price | Change |
|---|---|---|---|---|
| 1366.15 | 1368.25 | 1366.09 | 1366.97 | +1.34 |
| Prev. Close | Volume | Bid | Ask | Time |
| 1365.63 | 0 | 2024-04-26 00:32:00 |
| 52wk High | 797.9157 | 52wk High Date | 2018-01-25 |
| 52wk Low | 679.4947 | 52wk Low Date | 2018-08-16 |