Index Trend Analysis Report
Prepared for you on Saturday, April 20, 2024.
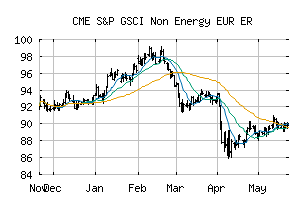
S&P GSCI Non Energy EUR ER (CME:SPGSNEERE)
Long-Term Uptrend (+90) - SPGSNEERE is in a strong uptrend that is likely to continue. While SPGSNEERE is showing intraday weakness, it remains in the confines of a bullish trend. Traders should use caution and utilize a stop order.
Is it time to buy, sell, or avoid SPGSNEERE?
MarketClub looks at technical strength and momentum to determine if the timing is right for SPGSNEERE.
Learn more about the Trade Triangles and how we make technical analysis as easy as buy and sell.
|
|||||||||||||||
|
|||||||||||||||
MarketClub’s Trade Triangles for SPGSNEERE
![]() The long-term trend has been UP since Mar 18th, 2024 at 87.871
The long-term trend has been UP since Mar 18th, 2024 at 87.871
![]() The intermediate-term trend has been UP since Mar 11th, 2024 at 86.729
The intermediate-term trend has been UP since Mar 11th, 2024 at 86.729
![]() The short-term trend has been UP since Mar 28th, 2024 at 88.645
The short-term trend has been UP since Mar 28th, 2024 at 88.645
Smart Scan Analysis for SPGSNEERE
Based on our trend formula, SPGSNEERE is rated as a +90 on a scale from -100 (Strong Downtrend) to +100 (Strong Uptrend).
| Open | High | Low | Price | Change |
|---|---|---|---|---|
| 92.819 | 93.571 | 92.525 | 93.544 | +0.687 |
| Prev. Close | Volume | Bid | Ask | Time |
| 93.380 | 0 | 2024-04-19 14:26:00 |
| 52wk High | 77.8633 | 52wk High Date | 2018-05-29 |
| 52wk Low | 67.1304 | 52wk Low Date | 2018-09-18 |