Index Trend Analysis Report
Prepared for you on Tuesday, April 23, 2024.
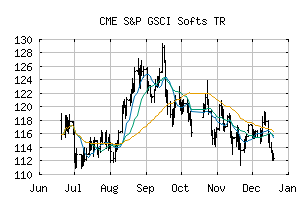
S&P GSCI Softs TR (CME:SPGSSFTR)
Weak Uptrend (+65) - SPGSSFTR is showing signs of weakening momentum to the upside. Monitor SPGSSFTR as it may be in the beginning stages of a reversal.
Is it time to buy, sell, or avoid SPGSSFTR?
MarketClub looks at technical strength and momentum to determine if the timing is right for SPGSSFTR.
Learn more about the Trade Triangles and how we make technical analysis as easy as buy and sell.
|
|||||||||||||||
|
|||||||||||||||
MarketClub’s Trade Triangles for SPGSSFTR
![]() The long-term trend has been UP since Feb 5th, 2024 at 93.912
The long-term trend has been UP since Feb 5th, 2024 at 93.912
![]() The intermediate-term trend has been UP since Jan 16th, 2024 at 86.824
The intermediate-term trend has been UP since Jan 16th, 2024 at 86.824
![]() The short-term trend has been DOWN since Apr 23rd, 2024 at 106.579
The short-term trend has been DOWN since Apr 23rd, 2024 at 106.579
Smart Scan Analysis for SPGSSFTR
Based on our trend formula, SPGSSFTR is rated as a +65 on a scale from -100 (Strong Downtrend) to +100 (Strong Uptrend).
| Open | High | Low | Price | Change |
|---|---|---|---|---|
| 107.844 | 108.037 | 104.526 | 105.539 | -2.328 |
| Prev. Close | Volume | Bid | Ask | Time |
| 107.867 | 0 | 2024-04-23 14:30:00 |
| 52wk High | 60.00628 | 52wk High Date | 2018-06-01 |
| 52wk Low | 48.12779 | 52wk Low Date | 2018-10-01 |