Forex Trend Analysis Report
Prepared for you on Tuesday, April 23, 2024.
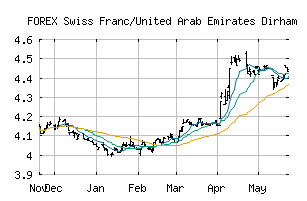
Swiss Franc/United Arab Emirates Dirham (FOREX:CHFAED)
Bear Market Rally (-75) - CHFAED is showing some rallying power, but still remains in the confines of a long-term downtrend. Keep an eye on CHFAED as it may be in the beginning of a reversal.
Is it time to buy, sell, or avoid CHFAED?
MarketClub looks at technical strength and momentum to determine if the timing is right for CHFAED.
Learn more about the Trade Triangles and how we make technical analysis as easy as buy and sell.
|
|||||||||||||||
|
|||||||||||||||
MarketClub’s Trade Triangles for CHFAED
![]() The long-term trend has been DOWN since Mar 1st, 2024 at 4.1416522
The long-term trend has been DOWN since Mar 1st, 2024 at 4.1416522
![]() The intermediate-term trend has been DOWN since Jan 16th, 2024 at 4.2809236
The intermediate-term trend has been DOWN since Jan 16th, 2024 at 4.2809236
![]() The short-term trend has been UP since Apr 17th, 2024 at 4.0233682
The short-term trend has been UP since Apr 17th, 2024 at 4.0233682
Smart Scan Analysis for CHFAED
Based on our trend formula, CHFAED is rated as a -75 on a scale from -100 (Strong Downtrend) to +100 (Strong Uptrend).
| Open | High | Low | Price | Change |
|---|---|---|---|---|
| 4.0294250 | 4.0294250 | 4.0288062 | 4.0288062 | -0.0006190 |
| Prev. Close | Volume | Bid | Ask | Time |
| 4.0294250 | 2024-04-23 18:00:04 |