Forex Trend Analysis Report
Prepared for you on Saturday, April 20, 2024.
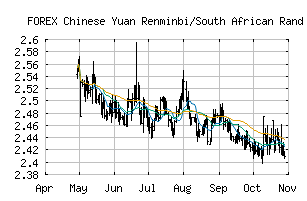
Chinese Yuan Renminbi/South African Rand (FOREX:CNYZAR)
Bull Market Weakness (+75) - CNYZAR is showing signs of short-term weakness, but still remains in the confines of a long-term uptrend. Keep an eye on CNYZAR as it may be in the beginning stages of a reversal.
Is it time to buy, sell, or avoid CNYZAR?
MarketClub looks at technical strength and momentum to determine if the timing is right for CNYZAR.
Learn more about the Trade Triangles and how we make technical analysis as easy as buy and sell.
|
|||||||||||||||
|
|||||||||||||||
MarketClub’s Trade Triangles for CNYZAR
![]() The long-term trend has been DOWN since Apr 9th, 2024 at 2.5590388
The long-term trend has been DOWN since Apr 9th, 2024 at 2.5590388
![]() The intermediate-term trend has been UP since Apr 17th, 2024 at 2.6893437
The intermediate-term trend has been UP since Apr 17th, 2024 at 2.6893437
![]() The short-term trend has been UP since Apr 18th, 2024 at 2.6933922
The short-term trend has been UP since Apr 18th, 2024 at 2.6933922
Smart Scan Analysis for CNYZAR
Based on our trend formula, CNYZAR is rated as a +70 on a scale from -100 (Strong Downtrend) to +100 (Strong Uptrend).
| Open | High | Low | Price | Change |
|---|---|---|---|---|
| 2.6581917 | 2.7174964 | 2.6335046 | 2.6676365 | +0.0094450 |
| Prev. Close | Volume | Bid | Ask | Time |
| 2.6581917 | 2024-04-19 19:42:32 |