Forex Trend Analysis Report
Prepared for you on Thursday, April 18, 2024.
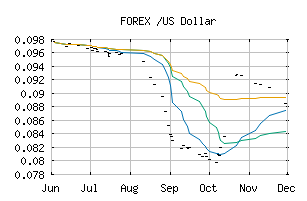
/US Dollar (FOREX:GHSUSD)
Strong Downtrend (-100) - GHSUSD is in a strong downtrend that is likely to continue. With short-term, intermediate, and long-term bearish momentum, GHSUSD continues to fall. Traders should use caution and set stops.
Is it time to buy, sell, or avoid GHSUSD?
MarketClub looks at technical strength and momentum to determine if the timing is right for GHSUSD.
Learn more about the Trade Triangles and how we make technical analysis as easy as buy and sell.
|
|||||||||||||||
|
|||||||||||||||
MarketClub’s Trade Triangles for GHSUSD
![]() The long-term trend has been DOWN since Oct 5th, 2023 at 0.08620868
The long-term trend has been DOWN since Oct 5th, 2023 at 0.08620868
![]() The intermediate-term trend has been DOWN since Jan 21st, 2024 at 0.08332101
The intermediate-term trend has been DOWN since Jan 21st, 2024 at 0.08332101
![]() The short-term trend has been DOWN since Feb 7th, 2024 at 0.08090751
The short-term trend has been DOWN since Feb 7th, 2024 at 0.08090751
Smart Scan Analysis for GHSUSD
Based on our trend formula, GHSUSD is rated as a -100 on a scale from -100 (Strong Downtrend) to +100 (Strong Uptrend).
| Open | High | Low | Price | Change |
|---|---|---|---|---|
| 0.07429876 | 0.07429876 | 0.07429876 | 0.07429876 | 0.00000000 |
| Prev. Close | Volume | Bid | Ask | Time |
| 0.07429876 | 2024-04-18 07:26:26 |