Forex Trend Analysis Report
Prepared for you on Wednesday, April 24, 2024.
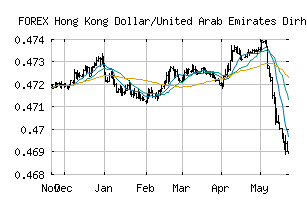
Hong Kong Dollar/United Arab Emirates Dirham (FOREX:HKDAED)
Countertrend Down (-85) - HKDAED is showing short-term strength. However, look for the longer-term bearish trend to resume. As always, continue to monitor the trend score and set stops.
Is it time to buy, sell, or avoid HKDAED?
MarketClub looks at technical strength and momentum to determine if the timing is right for HKDAED.
Learn more about the Trade Triangles and how we make technical analysis as easy as buy and sell.
|
|||||||||||||||
|
|||||||||||||||
MarketClub’s Trade Triangles for HKDAED
![]() The long-term trend has been DOWN since Feb 29th, 2024 at 0.46917760
The long-term trend has been DOWN since Feb 29th, 2024 at 0.46917760
![]() The intermediate-term trend has been DOWN since Apr 2nd, 2024 at 0.46915851
The intermediate-term trend has been DOWN since Apr 2nd, 2024 at 0.46915851
![]() The short-term trend has been UP since Apr 24th, 2024 at 0.46893633
The short-term trend has been UP since Apr 24th, 2024 at 0.46893633
Smart Scan Analysis for HKDAED
Based on our trend formula, HKDAED is rated as a -85 on a scale from -100 (Strong Downtrend) to +100 (Strong Uptrend).
| Open | High | Low | Price | Change |
|---|---|---|---|---|
| 0.46880546 | 0.46897424 | 0.46879077 | 0.46892465 | +0.00011900 |
| Prev. Close | Volume | Bid | Ask | Time |
| 0.46880546 | 2024-04-24 08:24:28 |