Forex Trend Analysis Report
Prepared for you on Friday, April 26, 2024.
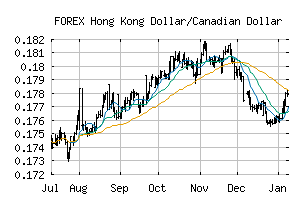
Hong Kong Dollar/Canadian Dollar (FOREX:HKDCAD)
Weak Uptrend (+65) - HKDCAD is showing signs of weakening momentum to the upside. Monitor HKDCAD as it may be in the beginning stages of a reversal.
Is it time to buy, sell, or avoid HKDCAD?
MarketClub looks at technical strength and momentum to determine if the timing is right for HKDCAD.
Learn more about the Trade Triangles and how we make technical analysis as easy as buy and sell.
|
|||||||||||||||
|
|||||||||||||||
MarketClub’s Trade Triangles for HKDCAD
![]() The long-term trend has been UP since Apr 5th, 2024 at 0.174036
The long-term trend has been UP since Apr 5th, 2024 at 0.174036
![]() The intermediate-term trend has been UP since Mar 19th, 2024 at 0.173890
The intermediate-term trend has been UP since Mar 19th, 2024 at 0.173890
![]() The short-term trend has been DOWN since Apr 19th, 2024 at 0.175495
The short-term trend has been DOWN since Apr 19th, 2024 at 0.175495
Smart Scan Analysis for HKDCAD
Based on our trend formula, HKDCAD is rated as a +65 on a scale from -100 (Strong Downtrend) to +100 (Strong Uptrend).
| Open | High | Low | Price | Change |
|---|---|---|---|---|
| 0.1744060 | 0.1749520 | 0.1741765 | 0.1745990 | +0.0001930 |
| Prev. Close | Volume | Bid | Ask | Time |
| 0.1744060 | 2024-04-26 16:37:32 |