Forex Trend Analysis Report
Prepared for you on Friday, April 19, 2024.
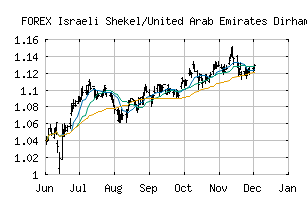
Israeli Shekel/United Arab Emirates Dirham (FOREX:ILSAED)
Long-Term Downtrend (-90) - ILSAED is in a strong downtrend that is likely to continue. While ILSAED is showing intraday strength, it remains in the confines of a bearish trend. Traders should use caution and set stops.
Is it time to buy, sell, or avoid ILSAED?
MarketClub looks at technical strength and momentum to determine if the timing is right for ILSAED.
Learn more about the Trade Triangles and how we make technical analysis as easy as buy and sell.
|
|||||||||||||||
|
|||||||||||||||
MarketClub’s Trade Triangles for ILSAED
![]() The long-term trend has been DOWN since Apr 18th, 2024 at 0.9676915
The long-term trend has been DOWN since Apr 18th, 2024 at 0.9676915
![]() The intermediate-term trend has been DOWN since Mar 28th, 2024 at 0.9969702
The intermediate-term trend has been DOWN since Mar 28th, 2024 at 0.9969702
![]() The short-term trend has been DOWN since Apr 17th, 2024 at 0.9730125
The short-term trend has been DOWN since Apr 17th, 2024 at 0.9730125
Smart Scan Analysis for ILSAED
Based on our trend formula, ILSAED is rated as a -90 on a scale from -100 (Strong Downtrend) to +100 (Strong Uptrend).
| Open | High | Low | Price | Change |
|---|---|---|---|---|
| 0.9635447 | 0.9737162 | 0.9630714 | 0.9682304 | +0.0046860 |
| Prev. Close | Volume | Bid | Ask | Time |
| 0.9635447 | 2024-04-18 15:27:35 |