Forex Trend Analysis Report
Prepared for you on Tuesday, April 23, 2024.
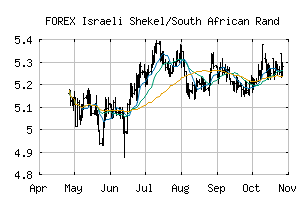
Israeli Shekel/South African Rand (FOREX:ILSZAR)
Weak Uptrend (+65) - ILSZAR is showing signs of weakening momentum to the upside. Monitor ILSZAR as it may be in the beginning stages of a reversal.
Is it time to buy, sell, or avoid ILSZAR?
MarketClub looks at technical strength and momentum to determine if the timing is right for ILSZAR.
Learn more about the Trade Triangles and how we make technical analysis as easy as buy and sell.
|
|||||||||||||||
|
|||||||||||||||
MarketClub’s Trade Triangles for ILSZAR
![]() The long-term trend has been UP since Dec 11th, 2023 at 5.1612570
The long-term trend has been UP since Dec 11th, 2023 at 5.1612570
![]() The intermediate-term trend has been DOWN since Mar 12th, 2024 at 5.1005215
The intermediate-term trend has been DOWN since Mar 12th, 2024 at 5.1005215
![]() The short-term trend has been UP since Apr 19th, 2024 at 5.1111531
The short-term trend has been UP since Apr 19th, 2024 at 5.1111531
Smart Scan Analysis for ILSZAR
Based on our trend formula, ILSZAR is rated as a +65 on a scale from -100 (Strong Downtrend) to +100 (Strong Uptrend).
| Open | High | Low | Price | Change |
|---|---|---|---|---|
| 5.0777989 | 5.1113473 | 5.0601081 | 5.0717979 | -0.0060010 |
| Prev. Close | Volume | Bid | Ask | Time |
| 5.0777989 | 2024-04-23 20:23:55 |