Forex Trend Analysis Report
Prepared for you on Friday, April 19, 2024.
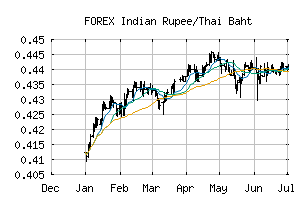
Indian Rupee/Thai Baht (FOREX:INRTHB)
Strong Uptrend (+100) - INRTHB is in a strong uptrend that is likely to continue. With short-term, intermediate, and long-term bullish momentum, INRTHB continues to climb. Traders should protect gains and look for a change in score to suggest a slow down in momentum.
Is it time to buy, sell, or avoid INRTHB?
MarketClub looks at technical strength and momentum to determine if the timing is right for INRTHB.
Learn more about the Trade Triangles and how we make technical analysis as easy as buy and sell.
|
|||||||||||||||
|
|||||||||||||||
MarketClub’s Trade Triangles for INRTHB
![]() The long-term trend has been UP since Mar 21st, 2024 at 0.43598511
The long-term trend has been UP since Mar 21st, 2024 at 0.43598511
![]() The intermediate-term trend has been UP since Mar 20th, 2024 at 0.43530095
The intermediate-term trend has been UP since Mar 20th, 2024 at 0.43530095
![]() The short-term trend has been UP since Apr 15th, 2024 at 0.43971354
The short-term trend has been UP since Apr 15th, 2024 at 0.43971354
Smart Scan Analysis for INRTHB
Based on our trend formula, INRTHB is rated as a +100 on a scale from -100 (Strong Downtrend) to +100 (Strong Uptrend).
| Open | High | Low | Price | Change |
|---|---|---|---|---|
| 0.44114634 | 0.44204473 | 0.44106378 | 0.44204473 | +0.00089800 |
| Prev. Close | Volume | Bid | Ask | Time |
| 0.44114634 | 2024-04-19 07:28:13 |