Forex Trend Analysis Report
Prepared for you on Thursday, April 18, 2024.
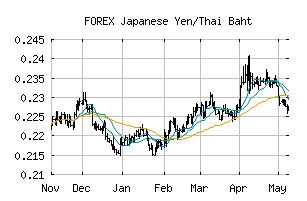
Japanese Yen/Thai Baht (FOREX:JPYTHB)
Long-Term Downtrend (-90) - JPYTHB is in a strong downtrend that is likely to continue. While JPYTHB is showing intraday strength, it remains in the confines of a bearish trend. Traders should use caution and set stops.
Is it time to buy, sell, or avoid JPYTHB?
MarketClub looks at technical strength and momentum to determine if the timing is right for JPYTHB.
Learn more about the Trade Triangles and how we make technical analysis as easy as buy and sell.
|
|||||||||||||||
|
|||||||||||||||
MarketClub’s Trade Triangles for JPYTHB
![]() The long-term trend has been DOWN since Sep 6th, 2022 at 0.25630960
The long-term trend has been DOWN since Sep 6th, 2022 at 0.25630960
![]() The intermediate-term trend has been DOWN since Apr 11th, 2024 at 0.23777023
The intermediate-term trend has been DOWN since Apr 11th, 2024 at 0.23777023
![]() The short-term trend has been DOWN since Apr 5th, 2024 at 0.24123015
The short-term trend has been DOWN since Apr 5th, 2024 at 0.24123015
Smart Scan Analysis for JPYTHB
Based on our trend formula, JPYTHB is rated as a -90 on a scale from -100 (Strong Downtrend) to +100 (Strong Uptrend).
| Open | High | Low | Price | Change |
|---|---|---|---|---|
| 0.23827000 | 0.23863920 | 0.23779476 | 0.23846692 | +0.00019700 |
| Prev. Close | Volume | Bid | Ask | Time |
| 0.23827000 | 2024-04-18 21:07:13 |