Forex Trend Analysis Report
Prepared for you on Thursday, April 25, 2024.
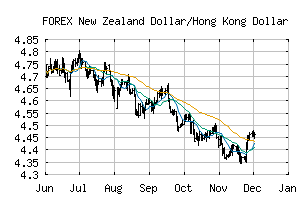
New Zealand Dollar/Hong Kong Dollar (FOREX:NZDHKD)
Countertrend Down (-85) - NZDHKD is showing short-term strength. However, look for the longer-term bearish trend to resume. As always, continue to monitor the trend score and set stops.
Is it time to buy, sell, or avoid NZDHKD?
MarketClub looks at technical strength and momentum to determine if the timing is right for NZDHKD.
Learn more about the Trade Triangles and how we make technical analysis as easy as buy and sell.
|
|||||||||||||||
|
|||||||||||||||
MarketClub’s Trade Triangles for NZDHKD
![]() The long-term trend has been DOWN since Mar 19th, 2024 at 4.7233186
The long-term trend has been DOWN since Mar 19th, 2024 at 4.7233186
![]() The intermediate-term trend has been DOWN since Mar 18th, 2024 at 4.7483000
The intermediate-term trend has been DOWN since Mar 18th, 2024 at 4.7483000
![]() The short-term trend has been UP since Apr 23rd, 2024 at 4.6459000
The short-term trend has been UP since Apr 23rd, 2024 at 4.6459000
Smart Scan Analysis for NZDHKD
Based on our trend formula, NZDHKD is rated as a -85 on a scale from -100 (Strong Downtrend) to +100 (Strong Uptrend).
| Open | High | Low | Price | Change |
|---|---|---|---|---|
| 4.6494367 | 4.6706713 | 4.6477000 | 4.6642672 | +0.0148310 |
| Prev. Close | Volume | Bid | Ask | Time |
| 4.6494367 | 2024-04-25 06:35:38 |