Forex Trend Analysis Report
Prepared for you on Friday, April 19, 2024.
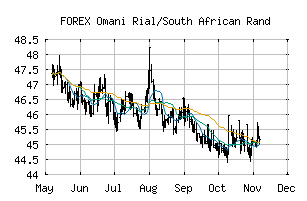
Omani Rial/South African Rand (FOREX:OMRZAR)
Crossroads (+60) - OMRZAR is struggling to move into a solid trend. Beware of choppy markets and consider a sidelines position until a stronger trend is identified.
Is it time to buy, sell, or avoid OMRZAR?
MarketClub looks at technical strength and momentum to determine if the timing is right for OMRZAR.
Learn more about the Trade Triangles and how we make technical analysis as easy as buy and sell.
|
|||||||||||||||
|
|||||||||||||||
MarketClub’s Trade Triangles for OMRZAR
![]() The long-term trend has been DOWN since Dec 21st, 2023 at 46.638784
The long-term trend has been DOWN since Dec 21st, 2023 at 46.638784
![]() The intermediate-term trend has been UP since Apr 16th, 2024 at 49.632653
The intermediate-term trend has been UP since Apr 16th, 2024 at 49.632653
![]() The short-term trend has been UP since Apr 10th, 2024 at 48.701520
The short-term trend has been UP since Apr 10th, 2024 at 48.701520
Smart Scan Analysis for OMRZAR
Based on our trend formula, OMRZAR is rated as a +60 on a scale from -100 (Strong Downtrend) to +100 (Strong Uptrend).
| Open | High | Low | Price | Change |
|---|---|---|---|---|
| 49.832660 | 50.046730 | 49.596925 | 49.722449 | -0.110211 |
| Prev. Close | Volume | Bid | Ask | Time |
| 49.832660 | 2024-04-19 09:09:30 |