Forex Trend Analysis Report
Prepared for you on Friday, April 19, 2024.
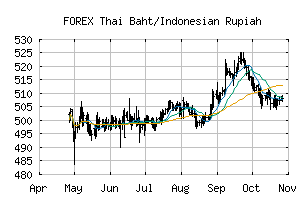
Thai Baht/Indonesian Rupiah (FOREX:THBIDR)
Bull Market Weakness (+75) - THBIDR is showing signs of short-term weakness, but still remains in the confines of a long-term uptrend. Keep an eye on THBIDR as it may be in the beginning stages of a reversal.
Is it time to buy, sell, or avoid THBIDR?
MarketClub looks at technical strength and momentum to determine if the timing is right for THBIDR.
Learn more about the Trade Triangles and how we make technical analysis as easy as buy and sell.
|
|||||||||||||||
|
|||||||||||||||
MarketClub’s Trade Triangles for THBIDR
![]() The long-term trend has been UP since Nov 22nd, 2023 at 443.36788
The long-term trend has been UP since Nov 22nd, 2023 at 443.36788
![]() The intermediate-term trend has been UP since Apr 11th, 2024 at 438.15131
The intermediate-term trend has been UP since Apr 11th, 2024 at 438.15131
![]() The short-term trend has been DOWN since Apr 16th, 2024 at 436.16753
The short-term trend has been DOWN since Apr 16th, 2024 at 436.16753
Smart Scan Analysis for THBIDR
Based on our trend formula, THBIDR is rated as a +75 on a scale from -100 (Strong Downtrend) to +100 (Strong Uptrend).
| Open | High | Low | Price | Change |
|---|---|---|---|---|
| 441.51578 | 441.89061 | 438.84638 | 440.33668 | -1.17910 |
| Prev. Close | Volume | Bid | Ask | Time |
| 441.51578 | 2024-04-19 17:02:45 |