Forex Trend Analysis Report
Prepared for you on Saturday, April 20, 2024.
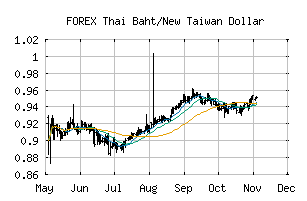
Thai Baht/New Taiwan Dollar (FOREX:THBTWD)
Sidelines Mode (-55) - THBTWD is moving in a sideways pattern and is unable to gain momentum in either direction. Beware of choppy movement and consider a sidelines position until a stronger trend is identified.
Is it time to buy, sell, or avoid THBTWD?
MarketClub looks at technical strength and momentum to determine if the timing is right for THBTWD.
Learn more about the Trade Triangles and how we make technical analysis as easy as buy and sell.
|
|||||||||||||||
|
|||||||||||||||
MarketClub’s Trade Triangles for THBTWD
![]() The long-term trend has been DOWN since Oct 2nd, 2023 at 0.8751629
The long-term trend has been DOWN since Oct 2nd, 2023 at 0.8751629
![]() The intermediate-term trend has been UP since Apr 16th, 2024 at 0.8879991
The intermediate-term trend has been UP since Apr 16th, 2024 at 0.8879991
![]() The short-term trend has been DOWN since Apr 18th, 2024 at 0.8791576
The short-term trend has been DOWN since Apr 18th, 2024 at 0.8791576
Smart Scan Analysis for THBTWD
Based on our trend formula, THBTWD is rated as a -55 on a scale from -100 (Strong Downtrend) to +100 (Strong Uptrend).
| Open | High | Low | Price | Change |
|---|---|---|---|---|
| 0.8826651 | 0.8844281 | 0.8789881 | 0.8834103 | +0.0007450 |
| Prev. Close | Volume | Bid | Ask | Time |
| 0.8826651 | 2024-04-19 17:02:45 |