Forex Trend Analysis Report
Prepared for you on Tuesday, April 16, 2024.
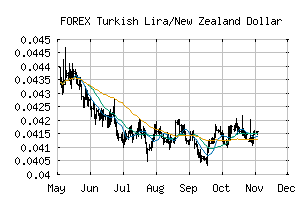
Turkish Lira/New Zealand Dollar (FOREX:TRYNZD)
Weak Downtrend (-65) - TRYNZD is showing signs of a strengthening downtrend. Monitor TRYNZD as it may be building momentum to the downside.
Is it time to buy, sell, or avoid TRYNZD?
MarketClub looks at technical strength and momentum to determine if the timing is right for TRYNZD.
Learn more about the Trade Triangles and how we make technical analysis as easy as buy and sell.
|
|||||||||||||||
|
|||||||||||||||
MarketClub’s Trade Triangles for TRYNZD
![]() The long-term trend has been DOWN since May 4th, 2023 at 0.081300
The long-term trend has been DOWN since May 4th, 2023 at 0.081300
![]() The intermediate-term trend has been DOWN since Apr 11th, 2024 at 0.050505
The intermediate-term trend has been DOWN since Apr 11th, 2024 at 0.050505
![]() The short-term trend has been UP since Apr 12th, 2024 at 0.051905
The short-term trend has been UP since Apr 12th, 2024 at 0.051905
Smart Scan Analysis for TRYNZD
Based on our trend formula, TRYNZD is rated as a -65 on a scale from -100 (Strong Downtrend) to +100 (Strong Uptrend).
| Open | High | Low | Price | Change |
|---|---|---|---|---|
| 0.052460 | 0.052465 | 0.052300 | 0.052390 | -0.000070 |
| Prev. Close | Volume | Bid | Ask | Time |
| 0.052460 | 2024-04-16 02:45:14 |