Forex Trend Analysis Report
Prepared for you on Thursday, April 25, 2024.
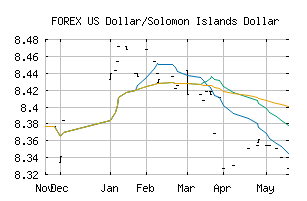
US Dollar/Solomon Islands Dollar (FOREX:USDSBD)
Countertrend Up (+85) - USDSBD is showing short-term weakness. However, look for the longer-term bullish trend to resume. As always, continue to monitor the trend score and utilize a stop order.
Is it time to buy, sell, or avoid USDSBD?
MarketClub looks at technical strength and momentum to determine if the timing is right for USDSBD.
Learn more about the Trade Triangles and how we make technical analysis as easy as buy and sell.
|
|||||||||||||||
|
|||||||||||||||
MarketClub’s Trade Triangles for USDSBD
![]() The long-term trend has been UP since Feb 21st, 2024 at 8.514493
The long-term trend has been UP since Feb 21st, 2024 at 8.514493
![]() The intermediate-term trend has been UP since Apr 23rd, 2024 at 8.489576
The intermediate-term trend has been UP since Apr 23rd, 2024 at 8.489576
![]() The short-term trend has been UP since Apr 23rd, 2024 at 8.482503
The short-term trend has been UP since Apr 23rd, 2024 at 8.482503
Smart Scan Analysis for USDSBD
Based on our trend formula, USDSBD is rated as a +80 on a scale from -100 (Strong Downtrend) to +100 (Strong Uptrend).
| Open | High | Low | Price | Change |
|---|---|---|---|---|
| 8.558809 | 8.558809 | 8.558809 | 8.558809 | 0.000000 |
| Prev. Close | Volume | Bid | Ask | Time |
| 8.533821 | 2024-04-24 14:24:14 |