Forex Trend Analysis Report
Prepared for you on Thursday, April 25, 2024.
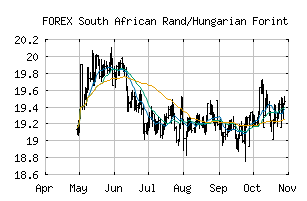
South African Rand/Hungarian Forint (FOREX:ZARHUF)
Crossroads (-60) - ZARHUF is struggling to move into a solid trend. Beware of choppy markets and consider a sidelines position until a stronger trend is identified.
Is it time to buy, sell, or avoid ZARHUF?
MarketClub looks at technical strength and momentum to determine if the timing is right for ZARHUF.
Learn more about the Trade Triangles and how we make technical analysis as easy as buy and sell.
|
|||||||||||||||
|
|||||||||||||||
MarketClub’s Trade Triangles for ZARHUF
![]() The long-term trend has been UP since Mar 5th, 2024 at 19.254072
The long-term trend has been UP since Mar 5th, 2024 at 19.254072
![]() The intermediate-term trend has been DOWN since Apr 23rd, 2024 at 19.154797
The intermediate-term trend has been DOWN since Apr 23rd, 2024 at 19.154797
![]() The short-term trend has been DOWN since Apr 23rd, 2024 at 19.257097
The short-term trend has been DOWN since Apr 23rd, 2024 at 19.257097
Smart Scan Analysis for ZARHUF
Based on our trend formula, ZARHUF is rated as a -60 on a scale from -100 (Strong Downtrend) to +100 (Strong Uptrend).
| Open | High | Low | Price | Change |
|---|---|---|---|---|
| 19.129925 | 19.152425 | 19.127959 | 19.148395 | +0.018470 |
| Prev. Close | Volume | Bid | Ask | Time |
| 19.129925 | 2024-04-25 01:11:17 |