Forex Trend Analysis Report
Prepared for you on Wednesday, April 17, 2024.
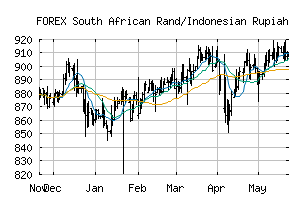
South African Rand/Indonesian Rupiah (FOREX:ZARIDR)
Countertrend Up (+85) - ZARIDR is showing short-term weakness. However, look for the longer-term bullish trend to resume. As always, continue to monitor the trend score and utilize a stop order.
Is it time to buy, sell, or avoid ZARIDR?
MarketClub looks at technical strength and momentum to determine if the timing is right for ZARIDR.
Learn more about the Trade Triangles and how we make technical analysis as easy as buy and sell.
|
|||||||||||||||
|
|||||||||||||||
MarketClub’s Trade Triangles for ZARIDR
![]() The long-term trend has been UP since Jul 28th, 2023 at 867.1327
The long-term trend has been UP since Jul 28th, 2023 at 867.1327
![]() The intermediate-term trend has been UP since Mar 5th, 2024 at 832.8781
The intermediate-term trend has been UP since Mar 5th, 2024 at 832.8781
![]() The short-term trend has been DOWN since Apr 15th, 2024 at 848.9966
The short-term trend has been DOWN since Apr 15th, 2024 at 848.9966
Smart Scan Analysis for ZARIDR
Based on our trend formula, ZARIDR is rated as a +85 on a scale from -100 (Strong Downtrend) to +100 (Strong Uptrend).
| Open | High | Low | Price | Change |
|---|---|---|---|---|
| 853.1413 | 859.6157 | 849.2666 | 855.8026 | +2.6613 |
| Prev. Close | Volume | Bid | Ask | Time |
| 853.1413 | 2024-04-17 22:23:03 |