Index Trend Analysis Report
Prepared for you on Saturday, February 21, 2026.
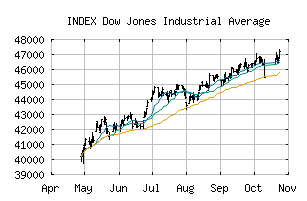
Dow Jones Industrial Average (INDEX:DJI)
Countertrend Up (+85) - DJI is showing short-term weakness. However, look for the longer-term bullish trend to resume. As always, continue to monitor the trend score and utilize a stop order.
Is it time to buy, sell, or avoid DJI?
MarketClub looks at technical strength and momentum to determine if the timing is right for DJI.
Learn more about the Trade Triangles and how we make technical analysis as easy as buy and sell.
|
|||||||||||||||
|
|||||||||||||||
MarketClub’s Trade Triangles for DJI
![]() The long-term trend has been UP since Jun 30th, 2025 at 44033.78
The long-term trend has been UP since Jun 30th, 2025 at 44033.78
![]() The intermediate-term trend has been UP since Dec 10th, 2025 at 48133.54
The intermediate-term trend has been UP since Dec 10th, 2025 at 48133.54
![]() The short-term trend has been DOWN since Feb 12th, 2026 at 49837.45
The short-term trend has been DOWN since Feb 12th, 2026 at 49837.45
Smart Scan Analysis for DJI
Based on our trend formula, DJI is rated as a +85 on a scale from -100 (Strong Downtrend) to +100 (Strong Uptrend).
| Open | High | Low | Price | Change |
|---|---|---|---|---|
| 49323.00 | 49712.56 | 49158.28 | 49625.97 | +230.81 |
| Prev. Close | Volume | Bid | Ask | Time |
| 49625.97 | 574181998 | 2026-02-20 16:19:29 |
| 52wk High | 26951.81 | 52wk High Date | 2018-10-03 |
| 52wk Low | 23344.52 | 52wk Low Date | 2018-04-02 |