Stock Trend Analysis Report
Prepared for you on Thursday, April 25, 2024.
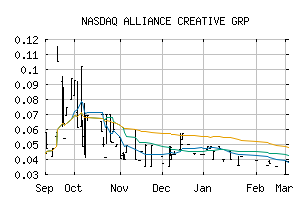
ALLIANCE CREATIVE GRP (NASDAQ:ACGX)
Weak Downtrend (-65) - ACGX is showing signs of a strengthening downtrend. Monitor ACGX as it may be building momentum to the downside.
Is it time to buy, sell, or avoid ACGX?
MarketClub looks at technical strength and momentum to determine if the timing is right for ACGX.
Learn more about the Trade Triangles and how we make technical analysis as easy as buy and sell.
|
|||||||||||||||
|
|||||||||||||||
MarketClub’s Trade Triangles for ACGX
![]() The long-term trend has been UP since Mar 8th, 2024 at 0.270
The long-term trend has been UP since Mar 8th, 2024 at 0.270
![]() The intermediate-term trend has been DOWN since Apr 19th, 2024 at 0.200
The intermediate-term trend has been DOWN since Apr 19th, 2024 at 0.200
![]() The short-term trend has been DOWN since Apr 19th, 2024 at 0.205
The short-term trend has been DOWN since Apr 19th, 2024 at 0.205
Smart Scan Analysis for ACGX
Based on our trend formula, ACGX is rated as a -70 on a scale from -100 (Strong Downtrend) to +100 (Strong Uptrend).
-70
Strong Downtrend
Sideways
Strong Uptrend
| Open | High | Low | Price | Change |
|---|---|---|---|---|
| 0.21423 | 0.21423 | 0.21423 | 0.21423 | +0.05323 |
| Prev. Close | Volume | Bid | Ask | Time |
| 0.16210 | 126 | 2024-04-24 11:52:58 |
| Year High | 0.00295 | Year High Date | 2018-03-01 |
| Year Low | 0.0004 | Year Low Date | 2018-11-15 |
| 52wk High | 0.57 | 52wk High Date | 2023-07-24 |
| 52wk Low | 0.127 | 52wk Low Date | 2023-12-13 |
| Year End Close | 0.003 | Average Volume | 5,428 |
| Assets | 3,957,989M | Liabilities | 2,347,690M |
| Beta | 0.98 | Volatility | 151.15 |
Get a free daily analysis and signals for ALLIANCE CREATIVE GRP (ACGX) - Request Your Free Report.