Index Trend Analysis Report
Prepared for you on Saturday, April 20, 2024.
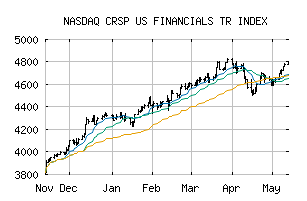
CRSP US FINANCIALS TR INDEX (NASDAQ:CRSPFNT)
Sidelines Mode (+55) - CRSPFNT is moving in a sideways pattern and is unable to gain momentum in either direction. Beware of choppy movement and consider a sidelines position until a stronger trend is identified.
Is it time to buy, sell, or avoid CRSPFNT?
MarketClub looks at technical strength and momentum to determine if the timing is right for CRSPFNT.
Learn more about the Trade Triangles and how we make technical analysis as easy as buy and sell.
|
|||||||||||||||
|
|||||||||||||||
MarketClub’s Trade Triangles for CRSPFNT
![]() The long-term trend has been UP since Nov 29th, 2023 at 4022.429
The long-term trend has been UP since Nov 29th, 2023 at 4022.429
![]() The intermediate-term trend has been DOWN since Apr 11th, 2024 at 4637.953
The intermediate-term trend has been DOWN since Apr 11th, 2024 at 4637.953
![]() The short-term trend has been UP since Apr 19th, 2024 at 4575.385
The short-term trend has been UP since Apr 19th, 2024 at 4575.385
Smart Scan Analysis for CRSPFNT
Based on our trend formula, CRSPFNT is rated as a +55 on a scale from -100 (Strong Downtrend) to +100 (Strong Uptrend).
| Open | High | Low | Price | Change |
|---|---|---|---|---|
| 4538.671 | 4601.679 | 4538.671 | 4597.093 | +58.425 |
| Prev. Close | Volume | Bid | Ask | Time |
| 4597.093 | 0 | 2024-04-19 16:12:00 |
| 52wk High | 2747.02 | 52wk High Date | 2018-09-20 |
| 52wk Low | 2420.06 | 52wk Low Date | 2018-10-26 |