Index Trend Analysis Report
Prepared for you on Tuesday, April 23, 2024.
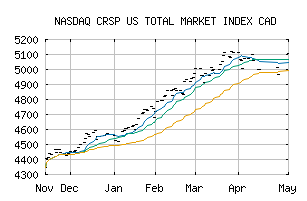
CRSP US TOTAL MARKET INDEX CAD (NASDAQ:CRSPTMC1)
Weak Downtrend (-65) - CRSPTMC1 is showing signs of a strengthening downtrend. Monitor CRSPTMC1 as it may be building momentum to the downside.
Is it time to buy, sell, or avoid CRSPTMC1?
MarketClub looks at technical strength and momentum to determine if the timing is right for CRSPTMC1.
Learn more about the Trade Triangles and how we make technical analysis as easy as buy and sell.
|
|||||||||||||||
|
|||||||||||||||
MarketClub’s Trade Triangles for CRSPTMC1
![]() The long-term trend has been UP since Nov 16th, 2023 at 4424.019
The long-term trend has been UP since Nov 16th, 2023 at 4424.019
![]() The intermediate-term trend has been DOWN since Apr 15th, 2024 at 5008.203
The intermediate-term trend has been DOWN since Apr 15th, 2024 at 5008.203
![]() The short-term trend has been DOWN since Apr 12th, 2024 at 5062.649
The short-term trend has been DOWN since Apr 12th, 2024 at 5062.649
Smart Scan Analysis for CRSPTMC1
Based on our trend formula, CRSPTMC1 is rated as a -70 on a scale from -100 (Strong Downtrend) to +100 (Strong Uptrend).
| Open | High | Low | Price | Change |
|---|---|---|---|---|
| 4997.508 | 4997.508 | 4997.508 | 4997.508 | -0.036 |
| Prev. Close | Volume | Bid | Ask | Time |
| 4920.660 | 0 | 2024-04-16 16:45:00 |
| 52wk High | 2849.7 | 52wk High Date | 2018-09-04 |
| 52wk Low | 2414.37 | 52wk Low Date | 2018-02-08 |