Mutual Trend Analysis Report
Prepared for you on Thursday, April 25, 2024.
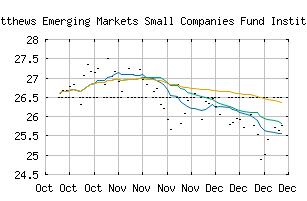
MATTHEWS EMERGING MARKETS SMALL COMPANIES FUND INSTITUTIONAL CLASS (NASDAQ:MISMX)
Long-Term Downtrend (-90) - MISMX is in a strong downtrend that is likely to continue. While MISMX is showing intraday strength, it remains in the confines of a bearish trend. Traders should use caution and set stops.
Is it time to buy, sell, or avoid MISMX?
MarketClub looks at technical strength and momentum to determine if the timing is right for MISMX.
Learn more about the Trade Triangles and how we make technical analysis as easy as buy and sell.
|
|||||||||||||||
|
|||||||||||||||
MarketClub’s Trade Triangles for MISMX
![]() The long-term trend has been DOWN since Oct 3rd, 2023 at 25.98
The long-term trend has been DOWN since Oct 3rd, 2023 at 25.98
![]() The intermediate-term trend has been DOWN since Apr 15th, 2024 at 25.24
The intermediate-term trend has been DOWN since Apr 15th, 2024 at 25.24
![]() The short-term trend has been DOWN since Apr 10th, 2024 at 26.16
The short-term trend has been DOWN since Apr 10th, 2024 at 26.16
Smart Scan Analysis for MISMX
Based on our trend formula, MISMX is rated as a -90 on a scale from -100 (Strong Downtrend) to +100 (Strong Uptrend).
| Open | High | Low | Price | Change |
|---|---|---|---|---|
| 24.42 | 24.42 | 24.42 | 25.15 | +0.15 |
| Prev. Close | Volume | Bid | Ask | Time |
| 24.57 | 0 | 24.57 | 24.57 | 2024-04-22 20:00:00 |
| 52wk High | 28.42 | 52wk High Date | 2023-07-31 |
| 52wk Low | 24.42 | 52wk Low Date | 2024-04-19 |
| Year End Close | 25.49 | Payment Date | 2019-12-17 |