Index Trend Analysis Report
Prepared for you on Saturday, April 20, 2024.
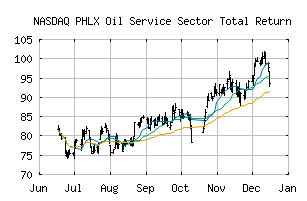
PHLX Oil Service Sector Total Return (NASDAQ:XOSX)
Crossroads (-60) - XOSX is struggling to move into a solid trend. Beware of choppy markets and consider a sidelines position until a stronger trend is identified.
Is it time to buy, sell, or avoid XOSX?
MarketClub looks at technical strength and momentum to determine if the timing is right for XOSX.
Learn more about the Trade Triangles and how we make technical analysis as easy as buy and sell.
|
|||||||||||||||
|
|||||||||||||||
MarketClub’s Trade Triangles for XOSX
![]() The long-term trend has been UP since Mar 13th, 2024 at 108.882
The long-term trend has been UP since Mar 13th, 2024 at 108.882
![]() The intermediate-term trend has been DOWN since Apr 15th, 2024 at 112.393
The intermediate-term trend has been DOWN since Apr 15th, 2024 at 112.393
![]() The short-term trend has been DOWN since Apr 9th, 2024 at 117.657
The short-term trend has been DOWN since Apr 9th, 2024 at 117.657
Smart Scan Analysis for XOSX
Based on our trend formula, XOSX is rated as a -60 on a scale from -100 (Strong Downtrend) to +100 (Strong Uptrend).
| Open | High | Low | Price | Change |
|---|---|---|---|---|
| 108.109 | 110.499 | 107.818 | 110.195 | +0.799 |
| Prev. Close | Volume | Bid | Ask | Time |
| 110.195 | 0 | 2024-04-19 17:15:09 |
| 52wk High | 193.23 | 52wk High Date | 2018-05-22 |
| 52wk Low | 116.39 | 52wk Low Date | 2018-11-23 |