Stock Trend Analysis Report
Prepared for you on Thursday, April 25, 2024.
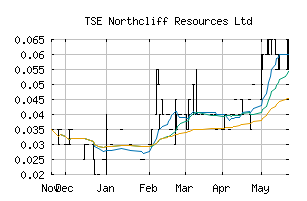
Northcliff Resources Ltd (TSE:NCF)
Strong Downtrend (-100) - NCF is in a strong downtrend that is likely to continue. With short-term, intermediate, and long-term bearish momentum, NCF continues to fall. Traders should use caution and set stops.
Is it time to buy, sell, or avoid NCF?
MarketClub looks at technical strength and momentum to determine if the timing is right for NCF.
Learn more about the Trade Triangles and how we make technical analysis as easy as buy and sell.
|
|||||||||||||||
|
|||||||||||||||
MarketClub’s Trade Triangles for NCF
![]() The long-term trend has been DOWN since Jan 24th, 2024 at 0.025
The long-term trend has been DOWN since Jan 24th, 2024 at 0.025
![]() The intermediate-term trend has been DOWN since Apr 24th, 2024 at 0.025
The intermediate-term trend has been DOWN since Apr 24th, 2024 at 0.025
![]() The short-term trend has been DOWN since Mar 7th, 2024 at 0.030
The short-term trend has been DOWN since Mar 7th, 2024 at 0.030
Smart Scan Analysis for NCF
Based on our trend formula, NCF is rated as a -100 on a scale from -100 (Strong Downtrend) to +100 (Strong Uptrend).
| Open | High | Low | Price | Change |
|---|---|---|---|---|
| 0.025 | 0.025 | 0.020 | 0.020 | -0.005 |
| Prev. Close | Volume | Bid | Ask | Time |
| 0.020 | 158000 | 2024-04-24 10:30:59 |
| Year High | 0.16 | Year High Date | 2018-01-02 |
| Year Low | 0.065 | Year Low Date | 2018-11-13 |
| 52wk High | 0.16 | 52wk High Date | 2017-12-27 |
| 52wk Low | 0.065 | 52wk Low Date | 2018-11-13 |
| Year End Close | 0.3 | Average Volume | 15,149 |
| Volatility | 89.48 |