Crypto Trend Analysis Report
Prepared for you on Thursday, August 7, 2025.
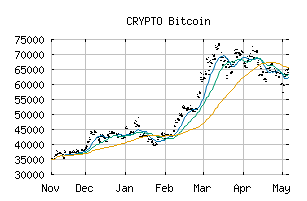
Bitcoin (CRYPTO:BTCUSD)
Weak Uptrend (+65) - BTCUSD is showing signs of weakening momentum to the upside. Monitor BTCUSD as it may be in the beginning stages of a reversal.
Is it time to buy, sell, or avoid BTCUSD?
MarketClub looks at technical strength and momentum to determine if the timing is right for BTCUSD.
Learn more about the Trade Triangles and how we make technical analysis as easy as buy and sell.
|
|||||||||||||||
|
|||||||||||||||
MarketClub’s Trade Triangles for BTCUSD
![]() The long-term trend has been UP since May 8th, 2025 at 102567.015
The long-term trend has been UP since May 8th, 2025 at 102567.015
![]() The intermediate-term trend has been UP since Jul 3rd, 2025 at 110430.875
The intermediate-term trend has been UP since Jul 3rd, 2025 at 110430.875
![]() The short-term trend has been DOWN since Aug 7th, 2025 at 115068.955
The short-term trend has been DOWN since Aug 7th, 2025 at 115068.955
Smart Scan Analysis for BTCUSD
Based on our trend formula, BTCUSD is rated as a +65 on a scale from -100 (Strong Downtrend) to +100 (Strong Uptrend).
| Open | High | Low | Price | Change |
|---|---|---|---|---|
| 114575.305 | 114719.425 | 114719.425 | 114600.025 | +24.720 |
| Prev. Close | Volume | Bid | Ask | Time |
| 114575.305 | 2025-08-07 02:28:16 |