Stock Trend Analysis Report
Prepared for you on Wednesday, February 5, 2025.
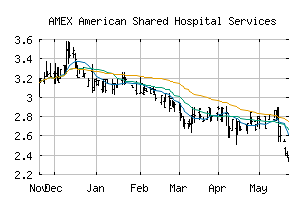
American Shared Hospital Services (AMEX:AMS)
Sidelines Mode (-50) - AMS is failing to move into a strong trend and is encountering choppy trading conditions. Be cautious and consider taking a sidelines position until AMS can gain momentum.
Is it time to buy, sell, or avoid AMS?
MarketClub looks at technical strength and momentum to determine if the timing is right for AMS.
Learn more about the Trade Triangles and how we make technical analysis as easy as buy and sell.
|
|||||||||||||||
|
|||||||||||||||
MarketClub’s Trade Triangles for AMS
![]() The long-term trend has been UP since Aug 22nd, 2024 at 3.69
The long-term trend has been UP since Aug 22nd, 2024 at 3.69
![]() The intermediate-term trend has been DOWN since Dec 27th, 2024 at 3.14
The intermediate-term trend has been DOWN since Dec 27th, 2024 at 3.14
![]() The short-term trend has been DOWN since Jan 28th, 2025 at 3.13
The short-term trend has been DOWN since Jan 28th, 2025 at 3.13
Smart Scan Analysis for AMS
Based on our trend formula, AMS is rated as a -50 on a scale from -100 (Strong Downtrend) to +100 (Strong Uptrend).
| Open | High | Low | Price | Change |
|---|---|---|---|---|
| 3.1400 | 3.1374 | 3.1374 | 3.1374 | -0.0126 |
| Prev. Close | Volume | Bid | Ask | Time |
| 3.0900 | 546 | 2025-02-04 12:17:18 |
| Year High | 3.95 | Year High Date | 2018-10-04 |
| Year Low | 2.2499 | Year Low Date | 2018-04-09 |
| 52wk High | 4.6 | 52wk High Date | 2024-08-22 |
| 52wk Low | 2.51 | 52wk Low Date | 2024-03-19 |
| Year End Close | 2.73 | Average Volume | 7,979 |
| Shares Outstanding | 6,420 | Short Interest | 3,843 |
| % Institutional | 9.2 | Market Cap | 14M |
| Assets | 63,269,000M | Liabilities | 36,846,000M |
| P/E Ratio | 5.0656 | Beta | 0.29 |
| Volatility | 61.17 |