Stock Trend Analysis Report
Prepared for you on Friday, April 3, 2026.
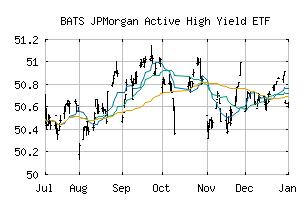
JPMorgan Active High Yield ETF (BATS:JPHY)
Weak Downtrend (-65) - JPHY is showing signs of a strengthening downtrend. Monitor JPHY as it may be building momentum to the downside.
Is it time to buy, sell, or avoid JPHY?
MarketClub looks at technical strength and momentum to determine if the timing is right for JPHY.
Learn more about the Trade Triangles and how we make technical analysis as easy as buy and sell.
|
|||||||||||||||
|
|||||||||||||||
MarketClub’s Trade Triangles for JPHY
![]() The long-term trend has been DOWN since Mar 2nd, 2026 at 50.440
The long-term trend has been DOWN since Mar 2nd, 2026 at 50.440
![]() The intermediate-term trend has been DOWN since Feb 2nd, 2026 at 50.650
The intermediate-term trend has been DOWN since Feb 2nd, 2026 at 50.650
![]() The short-term trend has been UP since Mar 31st, 2026 at 49.945
The short-term trend has been UP since Mar 31st, 2026 at 49.945
Smart Scan Analysis for JPHY
Based on our trend formula, JPHY is rated as a -65 on a scale from -100 (Strong Downtrend) to +100 (Strong Uptrend).
| Open | High | Low | Price | Change |
|---|---|---|---|---|
| 49.8500 | 50.0750 | 49.8600 | 50.0500 | +0.0445 |
| Prev. Close | Volume | Bid | Ask | Time |
| 50.0612 | 10965 | 2026-04-02 15:22:53 |