Stock Trend Analysis Report
Prepared for you on Tuesday, April 14, 2026.
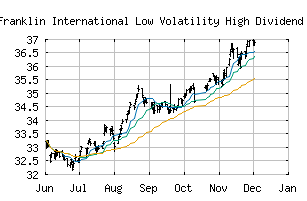
Franklin International Low Volatility High Dividend Index ETF (BATS:LVHI)
Countertrend Up (+85) - LVHI is showing short-term weakness. However, look for the longer-term bullish trend to resume. As always, continue to monitor the trend score and utilize a stop order.
Is it time to buy, sell, or avoid LVHI?
MarketClub looks at technical strength and momentum to determine if the timing is right for LVHI.
Learn more about the Trade Triangles and how we make technical analysis as easy as buy and sell.
|
|||||||||||||||
|
|||||||||||||||
MarketClub’s Trade Triangles for LVHI
![]() The long-term trend has been UP since May 15th, 2025 at 32.9100
The long-term trend has been UP since May 15th, 2025 at 32.9100
![]() The intermediate-term trend has been UP since Mar 31st, 2026 at 40.4699
The intermediate-term trend has been UP since Mar 31st, 2026 at 40.4699
![]() The short-term trend has been DOWN since Apr 13th, 2026 at 40.9500
The short-term trend has been DOWN since Apr 13th, 2026 at 40.9500
Smart Scan Analysis for LVHI
Based on our trend formula, LVHI is rated as a +85 on a scale from -100 (Strong Downtrend) to +100 (Strong Uptrend).
| Open | High | Low | Price | Change |
|---|---|---|---|---|
| 41.1300 | 41.1894 | 41.0100 | 41.1100 | -0.1800 |
| Prev. Close | Volume | Bid | Ask | Time |
| 41.2900 | 949472 | 2026-04-14 15:59:50 |
| Year High | 28.95 | Year High Date | 2018-01-09 |
| Year Low | 25.69 | Year Low Date | 2018-10-26 |
| 52wk High | 41.55 | 52wk High Date | 2026-02-26 |
| 52wk Low | 29.9 | 52wk Low Date | 2025-04-14 |
| Average Volume | 713,568 | Volatility | 8.43 |