Stock Trend Analysis Report
Prepared for you on Thursday, March 26, 2026.
FT Vest Nasdaq-100 Moderate Buffer ETF - May (BATS:QMMY)
Sidelines Mode (+55) - QMMY is moving in a sideways pattern and is unable to gain momentum in either direction. Beware of choppy movement and consider a sidelines position until a stronger trend is identified.
Is it time to buy, sell, or avoid QMMY?
MarketClub looks at technical strength and momentum to determine if the timing is right for QMMY.
Learn more about the Trade Triangles and how we make technical analysis as easy as buy and sell.
|
|||||||||||||||
|
|||||||||||||||
MarketClub’s Trade Triangles for QMMY
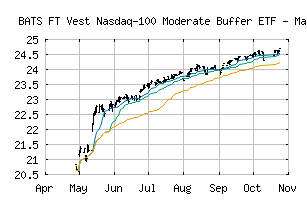
![]() The long-term trend has been UP since May 13th, 2025 at 22.2688
The long-term trend has been UP since May 13th, 2025 at 22.2688
![]() The intermediate-term trend has been DOWN since Feb 4th, 2026 at 24.9700
The intermediate-term trend has been DOWN since Feb 4th, 2026 at 24.9700
![]() The short-term trend has been UP since Mar 25th, 2026 at 25.0200
The short-term trend has been UP since Mar 25th, 2026 at 25.0200
Smart Scan Analysis for QMMY
Based on our trend formula, QMMY is rated as a +55 on a scale from -100 (Strong Downtrend) to +100 (Strong Uptrend).
| Open | High | Low | Price | Change |
|---|---|---|---|---|
| 25.015 | 25.075 | 25.010 | 25.010 | +0.089 |
| Prev. Close | Volume | Bid | Ask | Time |
| 25.012 | 695 | 2026-03-25 14:50:53 |