Stock Trend Analysis Report
Prepared for you on Saturday, October 26, 2024.
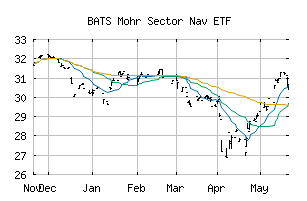
Mohr Sector Nav ETF (BATS:SNAV)
Bull Market Weakness (+75) - SNAV is showing signs of short-term weakness, but still remains in the confines of a long-term uptrend. Keep an eye on SNAV as it may be in the beginning stages of a reversal.
Is it time to buy, sell, or avoid SNAV?
MarketClub looks at technical strength and momentum to determine if the timing is right for SNAV.
Learn more about the Trade Triangles and how we make technical analysis as easy as buy and sell.
|
|||||||||||||||
|
|||||||||||||||
MarketClub’s Trade Triangles for SNAV
![]() The long-term trend has been UP since Dec 11th, 2023 at 27.4050
The long-term trend has been UP since Dec 11th, 2023 at 27.4050
![]() The intermediate-term trend has been UP since Sep 16th, 2024 at 30.3385
The intermediate-term trend has been UP since Sep 16th, 2024 at 30.3385
![]() The short-term trend has been DOWN since Oct 23rd, 2024 at 31.1400
The short-term trend has been DOWN since Oct 23rd, 2024 at 31.1400
Smart Scan Analysis for SNAV
Based on our trend formula, SNAV is rated as a +75 on a scale from -100 (Strong Downtrend) to +100 (Strong Uptrend).
| Open | High | Low | Price | Change |
|---|---|---|---|---|
| 30.9743 | 30.9300 | 30.8600 | 30.9300 | -0.0443 |
| Prev. Close | Volume | Bid | Ask | Time |
| 30.8692 | 1190 | 2024-10-24 12:30:20 |