Stock Trend Analysis Report
Prepared for you on Saturday, March 28, 2026.
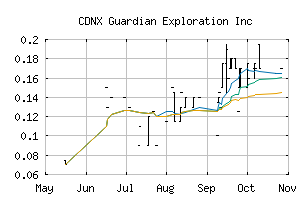
Guardian Exploration Inc (CDNX:GX)
Countertrend Up (+85) - GX is showing short-term weakness. However, look for the longer-term bullish trend to resume. As always, continue to monitor the trend score and utilize a stop order.
Is it time to buy, sell, or avoid GX?
MarketClub looks at technical strength and momentum to determine if the timing is right for GX.
Learn more about the Trade Triangles and how we make technical analysis as easy as buy and sell.
|
|||||||||||||||
|
|||||||||||||||
MarketClub’s Trade Triangles for GX
![]() The long-term trend has been UP since Oct 8th, 2024 at 0.055
The long-term trend has been UP since Oct 8th, 2024 at 0.055
![]() The intermediate-term trend has been UP since Feb 9th, 2026 at 0.190
The intermediate-term trend has been UP since Feb 9th, 2026 at 0.190
![]() The short-term trend has been UP since Mar 19th, 2026 at 0.220
The short-term trend has been UP since Mar 19th, 2026 at 0.220
Smart Scan Analysis for GX
Based on our trend formula, GX is rated as a +80 on a scale from -100 (Strong Downtrend) to +100 (Strong Uptrend).
| Open | High | Low | Price | Change |
|---|---|---|---|---|
| 0.25 | 0.25 | 0.23 | 0.25 | +0.02 |
| Prev. Close | Volume | Bid | Ask | Time |
| 0.25 | 14010 | 2026-03-26 15:33:36 |