Stock Trend Analysis Report
Prepared for you on Tuesday, February 17, 2026.
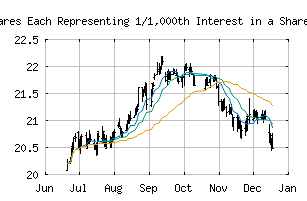
Arch Capital Group Ltd. - Depositary Shares Each Representing 1/1,000th Interest in a Share of5.45% Non-Cumulative Preferred Shares, Series F (NASDAQ:ACGLO)
Sidelines Mode (+50) - ACGLO is failing to move into a strong trend and is encountering choppy trading conditions. Be cautious and consider taking a sidelines position until ACGLO can gain momentum.
Is it time to buy, sell, or avoid ACGLO?
MarketClub looks at technical strength and momentum to determine if the timing is right for ACGLO.
Learn more about the Trade Triangles and how we make technical analysis as easy as buy and sell.
|
|||||||||||||||
|
|||||||||||||||
MarketClub’s Trade Triangles for ACGLO
![]() The long-term trend has been DOWN since Dec 15th, 2025 at 20.6617
The long-term trend has been DOWN since Dec 15th, 2025 at 20.6617
![]() The intermediate-term trend has been UP since Jan 12th, 2026 at 20.7300
The intermediate-term trend has been UP since Jan 12th, 2026 at 20.7300
![]() The short-term trend has been UP since Feb 10th, 2026 at 20.9850
The short-term trend has been UP since Feb 10th, 2026 at 20.9850
Smart Scan Analysis for ACGLO
Based on our trend formula, ACGLO is rated as a +50 on a scale from -100 (Strong Downtrend) to +100 (Strong Uptrend).
| Open | High | Low | Price | Change |
|---|---|---|---|---|
| 20.94 | 21.01 | 20.82 | 21.00 | +0.12 |
| Prev. Close | Volume | Bid | Ask | Time |
| 21.00 | 12092 | 2026-02-13 15:59:00 |
| Year High | 25.83 | Year High Date | 2018-01-19 |
| Year Low | 21.71 | Year Low Date | 2018-11-28 |
| 52wk High | 22.2 | 52wk High Date | 2025-09-11 |
| 52wk Low | 19.99 | 52wk Low Date | 2025-04-21 |
| Average Volume | 27,204 | Assets | 791,850,000M |
| Liabilities | 554,660,000M | Volatility | 7.36 |