Stock Trend Analysis Report
Prepared for you on Tuesday, April 14, 2026.
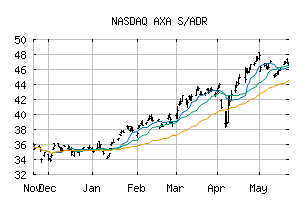
AXA S/ADR (NASDAQ:AXAHY)
Sidelines Mode (+55) - AXAHY is moving in a sideways pattern and is unable to gain momentum in either direction. Beware of choppy movement and consider a sidelines position until a stronger trend is identified.
Is it time to buy, sell, or avoid AXAHY?
MarketClub looks at technical strength and momentum to determine if the timing is right for AXAHY.
Learn more about the Trade Triangles and how we make technical analysis as easy as buy and sell.
|
|||||||||||||||
|
|||||||||||||||
MarketClub’s Trade Triangles for AXAHY
![]() The long-term trend has been DOWN since Mar 5th, 2026 at 44.2970
The long-term trend has been DOWN since Mar 5th, 2026 at 44.2970
![]() The intermediate-term trend has been UP since Mar 31st, 2026 at 45.3400
The intermediate-term trend has been UP since Mar 31st, 2026 at 45.3400
![]() The short-term trend has been DOWN since Apr 13th, 2026 at 47.9401
The short-term trend has been DOWN since Apr 13th, 2026 at 47.9401
Smart Scan Analysis for AXAHY
Based on our trend formula, AXAHY is rated as a +55 on a scale from -100 (Strong Downtrend) to +100 (Strong Uptrend).
| Open | High | Low | Price | Change |
|---|---|---|---|---|
| 47.900 | 48.915 | 47.830 | 48.915 | +0.585 |
| Prev. Close | Volume | Bid | Ask | Time |
| 48.330 | 306140 | 2026-04-13 15:57:00 |
| Year High | 33.86 | Year High Date | 2018-01-22 |
| Year Low | 23.532 | Year Low Date | 2018-11-23 |
| 52wk High | 50.95 | 52wk High Date | 2025-08-15 |
| 52wk Low | 41.975 | 52wk Low Date | 2025-04-11 |
| Year End Close | 18.22 | Average Volume | 137,349 |
| Shares Outstanding | 1,848,000 | Short Interest | 906,549 |
| % Institutional | 0.7 | Assets | 635,539,000M |
| Liabilities | 588,368,000M | Beta | 2.26 |
| Volatility | 18.68 |