Stock Trend Analysis Report
Prepared for you on Friday, April 3, 2026.
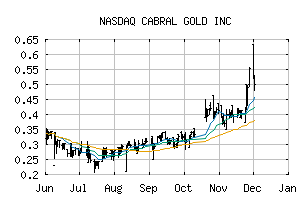
CABRAL GOLD INC (NASDAQ:CBGZF)
Weak Uptrend (+65) - CBGZF is showing signs of weakening momentum to the upside. Monitor CBGZF as it may be in the beginning stages of a reversal.
Is it time to buy, sell, or avoid CBGZF?
MarketClub looks at technical strength and momentum to determine if the timing is right for CBGZF.
Learn more about the Trade Triangles and how we make technical analysis as easy as buy and sell.
|
|||||||||||||||
|
|||||||||||||||
MarketClub’s Trade Triangles for CBGZF
![]() The long-term trend has been UP since Oct 8th, 2025 at 0.3435
The long-term trend has been UP since Oct 8th, 2025 at 0.3435
![]() The intermediate-term trend has been UP since Feb 25th, 2026 at 0.6000
The intermediate-term trend has been UP since Feb 25th, 2026 at 0.6000
![]() The short-term trend has been DOWN since Mar 26th, 2026 at 0.6466
The short-term trend has been DOWN since Mar 26th, 2026 at 0.6466
Smart Scan Analysis for CBGZF
Based on our trend formula, CBGZF is rated as a +65 on a scale from -100 (Strong Downtrend) to +100 (Strong Uptrend).
| Open | High | Low | Price | Change |
|---|---|---|---|---|
| 0.6407 | 0.6986 | 0.6407 | 0.6950 | +0.0130 |
| Prev. Close | Volume | Bid | Ask | Time |
| 0.6820 | 136598 | 2026-04-02 15:57:00 |
| Year High | 0.3236 | Year High Date | 2018-04-06 |
| Year Low | 0.151 | Year Low Date | 2018-11-26 |
| 52wk High | 0.99 | 52wk High Date | 2026-03-12 |
| 52wk Low | 0.208 | 52wk Low Date | 2025-07-17 |
| Average Volume | 405,499 | Shares Outstanding | 31,052 |
| Assets | 68,620,691M | Liabilities | 4,596,891M |
| Volatility | 166.6 |