Stock Trend Analysis Report
Prepared for you on Saturday, May 10, 2025.
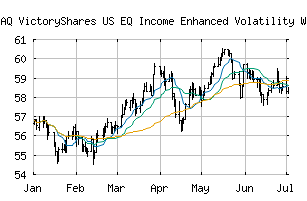
VictoryShares US EQ Income Enhanced Volatility Wtd ETF (NASDAQ:CDC)
Crossroads (+60) - CDC is struggling to move into a solid trend. Beware of choppy markets and consider a sidelines position until a stronger trend is identified.
Is it time to buy, sell, or avoid CDC?
MarketClub looks at technical strength and momentum to determine if the timing is right for CDC.
Learn more about the Trade Triangles and how we make technical analysis as easy as buy and sell.
|
|||||||||||||||
|
|||||||||||||||
MarketClub’s Trade Triangles for CDC
![]() The long-term trend has been DOWN since Dec 18th, 2024 at 61.852
The long-term trend has been DOWN since Dec 18th, 2024 at 61.852
![]() The intermediate-term trend has been UP since May 2nd, 2025 at 62.589
The intermediate-term trend has been UP since May 2nd, 2025 at 62.589
![]() The short-term trend has been UP since May 8th, 2025 at 62.612
The short-term trend has been UP since May 8th, 2025 at 62.612
Smart Scan Analysis for CDC
Based on our trend formula, CDC is rated as a +60 on a scale from -100 (Strong Downtrend) to +100 (Strong Uptrend).
| Open | High | Low | Price | Change |
|---|---|---|---|---|
| 62.119 | 62.388 | 61.985 | 62.123 | +0.005 |
| Prev. Close | Volume | Bid | Ask | Time |
| 62.070 | 0 | 2025-05-09 17:13:47 |
| Year High | 48.81 | Year High Date | 2018-01-29 |
| Year Low | 43.73 | Year Low Date | 2018-02-09 |
| 52wk High | 67.7599 | 52wk High Date | 2024-11-27 |
| 52wk Low | 57.37 | 52wk Low Date | 2025-04-09 |
| Average Volume | 23,988 | Shares Outstanding | 11,700 |
| Market Cap | 675M | Volatility | 12.86 |