Stock Trend Analysis Report
Prepared for you on Friday, January 23, 2026.
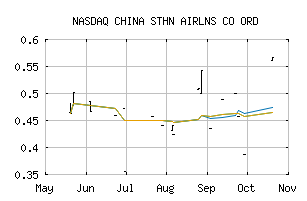
CHINA STHN AIRLNS CO ORD (NASDAQ:CHKIF)
Countertrend Up (+85) - CHKIF is showing short-term weakness. However, look for the longer-term bullish trend to resume. As always, continue to monitor the trend score and utilize a stop order.
Is it time to buy, sell, or avoid CHKIF?
MarketClub looks at technical strength and momentum to determine if the timing is right for CHKIF.
Learn more about the Trade Triangles and how we make technical analysis as easy as buy and sell.
|
|||||||||||||||
|
|||||||||||||||
MarketClub’s Trade Triangles for CHKIF
![]() The long-term trend has been UP since Oct 20th, 2025 at 0.54190
The long-term trend has been UP since Oct 20th, 2025 at 0.54190
![]() The intermediate-term trend has been UP since Oct 20th, 2025 at 0.38726
The intermediate-term trend has been UP since Oct 20th, 2025 at 0.38726
![]() The short-term trend has been UP since Oct 20th, 2025 at 0.50000
The short-term trend has been UP since Oct 20th, 2025 at 0.50000
Smart Scan Analysis for CHKIF
Based on our trend formula, CHKIF is rated as a +80 on a scale from -100 (Strong Downtrend) to +100 (Strong Uptrend).
| Open | High | Low | Price | Change |
|---|---|---|---|---|
| 0.76 | 0.76 | 0.76 | 0.76 | +0.01 |
| Prev. Close | Volume | Bid | Ask | Time |
| 0.76 | 37500 | 2026-01-21 11:05:00 |
| Year High | 1.37 | Year High Date | 2018-03-13 |
| Year Low | 0.53 | Year Low Date | 2018-10-30 |
| 52wk High | 0.76 | 52wk High Date | 2026-01-21 |
| 52wk Low | 0.347 | 52wk Low Date | 2025-06-30 |
| Average Volume | 13,083 | Assets | 340,579,000M |
| Liabilities | 303,544,000M | Volatility | 149.32 |