Stock Trend Analysis Report
Prepared for you on Tuesday, March 31, 2026.
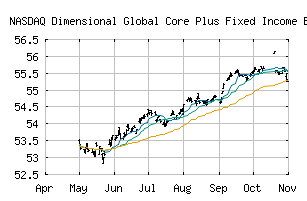
Dimensional Global Core Plus Fixed Income ETF (NASDAQ:DFGP)
Strong Downtrend (-100) - DFGP is in a strong downtrend that is likely to continue. With short-term, intermediate, and long-term bearish momentum, DFGP continues to fall. Traders should use caution and set stops.
Is it time to buy, sell, or avoid DFGP?
MarketClub looks at technical strength and momentum to determine if the timing is right for DFGP.
Learn more about the Trade Triangles and how we make technical analysis as easy as buy and sell.
|
|||||||||||||||
|
|||||||||||||||
MarketClub’s Trade Triangles for DFGP
![]() The long-term trend has been DOWN since Dec 10th, 2025 at 54.479
The long-term trend has been DOWN since Dec 10th, 2025 at 54.479
![]() The intermediate-term trend has been DOWN since Mar 6th, 2026 at 54.449
The intermediate-term trend has been DOWN since Mar 6th, 2026 at 54.449
![]() The short-term trend has been DOWN since Mar 26th, 2026 at 53.570
The short-term trend has been DOWN since Mar 26th, 2026 at 53.570
Smart Scan Analysis for DFGP
Based on our trend formula, DFGP is rated as a -100 on a scale from -100 (Strong Downtrend) to +100 (Strong Uptrend).
| Open | High | Low | Price | Change |
|---|---|---|---|---|
| 53.6600 | 53.8000 | 53.6150 | 53.6500 | +0.2486 |
| Prev. Close | Volume | Bid | Ask | Time |
| 53.6453 | 208372 | 2026-03-30 15:59:51 |
| 52wk High | 56.17 | 52wk High Date | 2025-10-16 |
| 52wk Low | 51.92 | 52wk Low Date | 2025-04-09 |
| Average Volume | 148,636 |