Stock Trend Analysis Report
Prepared for you on Wednesday, April 8, 2026.
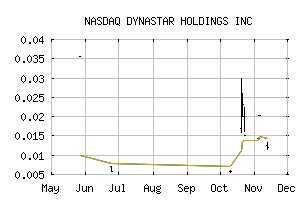
DYNASTAR HOLDINGS INC (NASDAQ:DYNA)
Countertrend Up (+85) - DYNA is showing short-term weakness. However, look for the longer-term bullish trend to resume. As always, continue to monitor the trend score and utilize a stop order.
Is it time to buy, sell, or avoid DYNA?
MarketClub looks at technical strength and momentum to determine if the timing is right for DYNA.
Learn more about the Trade Triangles and how we make technical analysis as easy as buy and sell.
|
|||||||||||||||
|
|||||||||||||||
MarketClub’s Trade Triangles for DYNA
![]() The long-term trend has been UP since Mar 24th, 2026 at 0.00585
The long-term trend has been UP since Mar 24th, 2026 at 0.00585
![]() The intermediate-term trend has been UP since Mar 24th, 2026 at 0.00520
The intermediate-term trend has been UP since Mar 24th, 2026 at 0.00520
![]() The short-term trend has been UP since Mar 24th, 2026 at 0.00520
The short-term trend has been UP since Mar 24th, 2026 at 0.00520
Smart Scan Analysis for DYNA
Based on our trend formula, DYNA is rated as a +80 on a scale from -100 (Strong Downtrend) to +100 (Strong Uptrend).
| Open | High | Low | Price | Change |
|---|---|---|---|---|
| 0.0064 | 0.0064 | 0.0064 | 0.0064 | +0.0014 |
| Prev. Close | Volume | Bid | Ask | Time |
| 0.0050 | 59990 | 2026-03-24 13:22:52 |
| Year High | 0.09 | Year High Date | 2018-01-24 |
| Year Low | 0.055 | Year Low Date | 2018-02-27 |
| 52wk High | 0.1 | 52wk High Date | 2025-04-30 |
| 52wk Low | 0.0015 | 52wk Low Date | 2025-10-17 |
| Average Volume | 62,057 | Shares Outstanding | 38,084 |
| Volatility | 776.41 |