Stock Trend Analysis Report
Prepared for you on Friday, April 3, 2026.
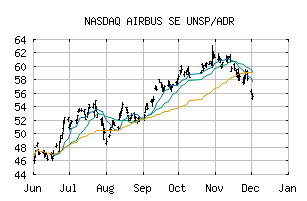
AIRBUS SE UNSP/ADR (NASDAQ:EADSY)
Bear Market Rally (-75) - EADSY is showing some rallying power, but still remains in the confines of a long-term downtrend. Keep an eye on EADSY as it may be in the beginning of a reversal.
Is it time to buy, sell, or avoid EADSY?
MarketClub looks at technical strength and momentum to determine if the timing is right for EADSY.
Learn more about the Trade Triangles and how we make technical analysis as easy as buy and sell.
|
|||||||||||||||
|
|||||||||||||||
MarketClub’s Trade Triangles for EADSY
![]() The long-term trend has been DOWN since Feb 19th, 2026 at 55.045
The long-term trend has been DOWN since Feb 19th, 2026 at 55.045
![]() The intermediate-term trend has been DOWN since Jan 26th, 2026 at 60.160
The intermediate-term trend has been DOWN since Jan 26th, 2026 at 60.160
![]() The short-term trend has been UP since Apr 1st, 2026 at 47.430
The short-term trend has been UP since Apr 1st, 2026 at 47.430
Smart Scan Analysis for EADSY
Based on our trend formula, EADSY is rated as a -75 on a scale from -100 (Strong Downtrend) to +100 (Strong Uptrend).
| Open | High | Low | Price | Change |
|---|---|---|---|---|
| 46.90 | 48.21 | 46.87 | 47.76 | -0.69 |
| Prev. Close | Volume | Bid | Ask | Time |
| 47.76 | 923122 | 2026-04-02 15:59:00 |
| Year High | 32.25 | Year High Date | 2018-08-29 |
| Year Low | 24.81 | Year Low Date | 2018-01-02 |
| 52wk High | 64.35 | 52wk High Date | 2026-01-13 |
| 52wk Low | 36.28 | 52wk Low Date | 2025-04-09 |
| Year End Close | 39.71 | Average Volume | 1,064,160 |
| Shares Outstanding | 819,057 | Assets | 134,939,000M |
| Liabilities | 108,835,000M | Beta | 0.94 |
| Volatility | 23.75 |