Stock Trend Analysis Report
Prepared for you on Wednesday, March 25, 2026.
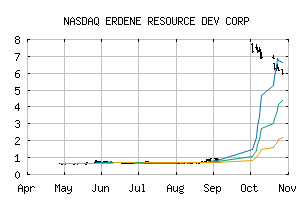
ERDENE RESOURCE DEV CORP (NASDAQ:ERDCF)
Countertrend Down (-85) - ERDCF is showing short-term strength. However, look for the longer-term bearish trend to resume. As always, continue to monitor the trend score and set stops.
Is it time to buy, sell, or avoid ERDCF?
MarketClub looks at technical strength and momentum to determine if the timing is right for ERDCF.
Learn more about the Trade Triangles and how we make technical analysis as easy as buy and sell.
|
|||||||||||||||
|
|||||||||||||||
MarketClub’s Trade Triangles for ERDCF
![]() The long-term trend has been DOWN since Mar 13th, 2026 at 5.142
The long-term trend has been DOWN since Mar 13th, 2026 at 5.142
![]() The intermediate-term trend has been DOWN since Mar 5th, 2026 at 5.610
The intermediate-term trend has been DOWN since Mar 5th, 2026 at 5.610
![]() The short-term trend has been UP since Mar 24th, 2026 at 4.420
The short-term trend has been UP since Mar 24th, 2026 at 4.420
Smart Scan Analysis for ERDCF
Based on our trend formula, ERDCF is rated as a -85 on a scale from -100 (Strong Downtrend) to +100 (Strong Uptrend).
| Open | High | Low | Price | Change |
|---|---|---|---|---|
| 4.46 | 4.69 | 4.46 | 4.60 | +0.16 |
| Prev. Close | Volume | Bid | Ask | Time |
| 4.44 | 21774 | 2026-03-25 15:36:00 |
| Year High | 0.49 | Year High Date | 2018-01-02 |
| Year Low | 0.1564 | Year Low Date | 2018-11-27 |
| 52wk High | 0.95743 | 52wk High Date | 2025-09-03 |
| 52wk Low | 0.3031 | 52wk Low Date | 2024-09-12 |
| Average Volume | 133,522 | Shares Outstanding | 90,313 |
| Assets | 56,467,248M | Liabilities | 1,218,497M |
| P/E Ratio | -46.14500000 | Volatility | 60.1 |