Stock Trend Analysis Report
Prepared for you on Wednesday, July 30, 2025.
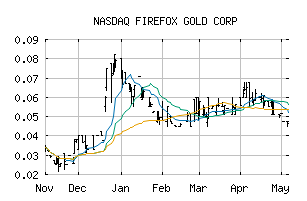
FIREFOX GOLD CORP (NASDAQ:FFOXF)
Countertrend Up (+85) - FFOXF is showing short-term weakness. However, look for the longer-term bullish trend to resume. As always, continue to monitor the trend score and utilize a stop order.
Is it time to buy, sell, or avoid FFOXF?
MarketClub looks at technical strength and momentum to determine if the timing is right for FFOXF.
Learn more about the Trade Triangles and how we make technical analysis as easy as buy and sell.
|
|||||||||||||||
|
|||||||||||||||
MarketClub’s Trade Triangles for FFOXF
![]() The long-term trend has been UP since Mar 31st, 2025 at 0.0320
The long-term trend has been UP since Mar 31st, 2025 at 0.0320
![]() The intermediate-term trend has been UP since Jul 7th, 2025 at 0.0342
The intermediate-term trend has been UP since Jul 7th, 2025 at 0.0342
![]() The short-term trend has been DOWN since Jul 25th, 2025 at 0.0400
The short-term trend has been DOWN since Jul 25th, 2025 at 0.0400
Smart Scan Analysis for FFOXF
Based on our trend formula, FFOXF is rated as a +85 on a scale from -100 (Strong Downtrend) to +100 (Strong Uptrend).
| Open | High | Low | Price | Change |
|---|---|---|---|---|
| 0.04245 | 0.04245 | 0.03990 | 0.04240 | +0.00002 |
| Prev. Close | Volume | Bid | Ask | Time |
| 0.04500 | 77270 | 2025-07-29 12:10:00 |